
Oregon’s COVID-19 situation needs improvement
Last updated 9/30/2020 at Noon
In 2020, our lives have been influenced greatly by COVID-19. Unfortunately, many families have experienced personal, tragic loss.
In every facet of normal life throughout Oregon — its 4.3 million residents and 36 counties — Governor Brown’s decisions and proclamations have a timely, important impact on all of us. In the United States, we just surpassed 205,000 deaths.
Following are key facts about Oregon’s COVID-19 situation from the Oregon Health Authority (OHA) website, https://govstatus.egov.com/OR-OHA-COVID-19. Note: COVID-19 reporting procedures are dynamic — with the objective to capture and use data better.
First case: February 28
First death: March 14
Oregon statics (as of 9/27): 32,820 cases, 2,470 hospitalizations, 547 deaths
Deschutes County (as of 9/27): 810 cases, 62 hospitalizations, 12 deaths
Sisters, OR (as of 9/25): 25 cases
How do we better understand COVID-19 and its impact? We look at its past process behavior. Everything is a process. Then, we overlay important events to understand cause-and-effect. Our analysis specifically looks for sustainability, predictability, and associated impact(s).
An important example of the analysis? There is one hospitalization in 13 diagnosed COVID-19 cases; the hospitalization rate is 7.7 percent to the number to cases. Of course, that is a major health and societal outcome of contracting COVID-19.
Within the COVID-19 behavior, we analyzed total cases and resultant hospitalizations from February 2 through September 19.
A key conclusion that was quantified?
We need to reduce the current, weekly average case number from 1,564 weekly cases (August 2 - September 19) to the minimal, “statistically derived, stay-at-home” number of 437. That is a herculean reduction of 358 percent! Importantly, the correlated hospitalization rate would decline significantly as well.
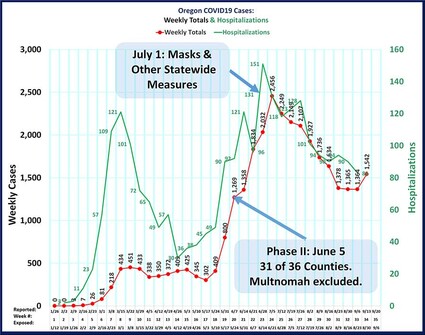
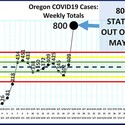
In the Oregon COVID-19 Cases chart (see chart, this page), each week is from Sunday through Saturday. Two critical events are plotted, Oregon’s Reopening (June 5) and the Masks/Enhanced Safety Proclamation (July 1).
The top date on the x-axis is the date of tallied/presented data by the OHA. The lower date assumes when COVID-19 may have been contracted – 14 days prior. By using this barometer, we gain information — such as possible increases after holidays.
There are four different stages in the COVID-19 process behavior graph. Now, it seems, we are entering into Stage 5.
Stage 1: Early indications of COVID; February 2 through March 7.
Stage 2: Governor Brown’s “Stay Home, Save Lives” order; March 23 - early June.
Stage 3: Re-opening of 31 of 36 Oregon counties.
Stage 4: Statewide mask/safety measures. July 1 through present.
From February through May 24, the hospitalization rate to the cases was higher than the subsequent period. Perhaps Oregon’s medical professionals were compassionately conservative to further diagnosis/treatment? After April 26th, more available testing could have reduced the prior hospitalization to case percentage, too. Our heroic medical staffs were using medicine and technology to provide their best diagnosis and care.
Weekly cases were quite predictable during the “Stay Home, Save Lives” period. From March 15 through May 30, weekly cases averaged 388; ranging from 302 to 451. This proclamation’s results show the total case was relatively stable; thereby our hunkered-down behavior effective. “Not good,” however, since people were adversely affected stiller, but steadily.
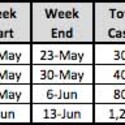
With Oregon’s reopening enacted on June 5, 31 of 36 Oregon counties entering the state’s defined Phase II status, cases rose significantly.
Afterward, cases continued to rise dramatically; the week of July 5, peaking at 2,456.
To flatten the case uptick, on July 1, Governor Brown proclaimed the statewide mask/enhanced safety regulations. This produced a major, statistically predictable decline in the number of total cases and hospitalizations
Since August 23, total weekly cases have flattened, averaging 1,412 per week. This level is similar to total cases in mid-June, before the mask/enhanced safety measure proclamation.
We are going into the fall now when influenza increases historically, in part, due to schools reopening as well as people being in closed quarters. Within Oregon, we have much difference with in-person/online school attendance.
Providing a proven calculation for entering a comparative number of cases seen in the “Stay Home, Save Lives” period (March 23-early-June), the mean (average) and standard deviations were determined as well as plotted. Those are: ±1, green; ±2, yellow; ±, red; average (mean) blue.
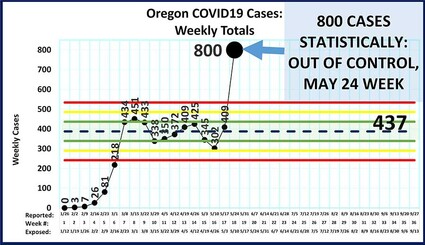
This analysis dramatically shows that the week of May 31 had 800 COVID-19 cases and was statically out-of-control — neither stable nor consistent. In retrospect, this was a tremendous warning that things were worsening! More weeks at high levels validate this conclusion.
Using this chart, a conservative, “new normal” COVID-19 weekly total case level, would be 437. That is derived from the March 8-May 17 period’s average, 388, and adding one standard deviation, 49.
Many variables are influencing this process. Importantly, we want to understand and know when the COVID-19 situation is objectively turning the corner.
These numbers do not tell of personal hardship, grief, loss and tragedy for an extraordinary number of families.
COVID-19 rages. With numeric understanding, balanced, prudent, and consistent actions may be able to turn this tide.


Reader Comments(0)